Ballantyne Real Estate December 2022
Ballantyne real estate market December 2022 saw higher home prices and new listings down 58.4% year-over-year. Months supply of inventory was under one month at 0.8 months, which is extremely low. Days on market increased. Sellers saw a lower median list price to final sale price at 96.4%. Closed and pending sales were down. The “feeding frenzy” of 2021 and first half of 2022 is over in the Ballantyne area.
BALLANTYNE REAL ESTATE DECEMBER 2022 HIGHLIGHTS
 Latest news Ballantyne real estate December 2022 and what it means for you…
The Ballantyne housing market continued to cool in the month of December with lower closed and pending sales, higher days on market, lower list to sale price ratio, and more inventory. However, with just 0.8 months of inventory and new listings down month after month, Ballantyne area is no where near being a buyer’s market yet.
While inventory increased and the months supply of homes increased to 0.8 months, Ballantyne homes sold in under 5 weeks, on average, and at higher prices year-over-year. Home sellers received a median 96.4% of list price in sale price, which was a tad higher than in the previous month of November.
Foot traffic was down, with the average home seeing 10.4 showings in December 2022 compared with 21.1 showings in December 2021. With inventory at just a one half month’s supply one year ago, foot traffic was understandably very high as buyers competed for a small supply of homes last year. Compared with November 2022, foot traffic was higher at 10.4 showings in December versus 9.5 showings per listing in November.
With closed and pending sales down, Ballantyne’s housing market is returning to more of a pre-pandemic rate of sales and the “feeding frenzy” we saw in 2021 and earlier in 2022 has abated.
BALLANTYNE REAL ESTATE SNAPSHOT
DECEMBER 2022 vs DECEMBER 2021

BALLANTYNE HOME SALE PRICES UP YEAR-OVER-YEAR | DOWN MONTH-OVER-MONTH
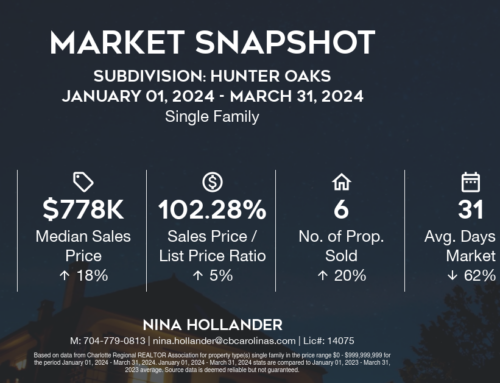
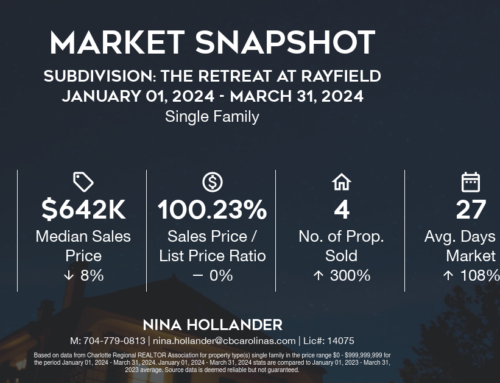
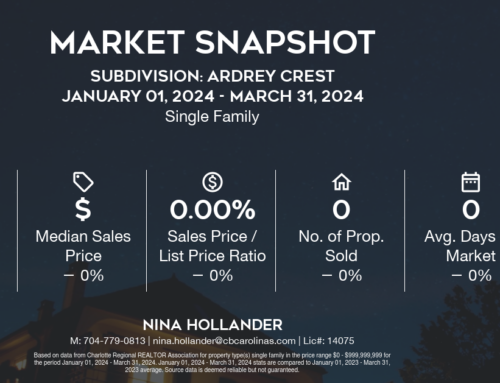
Average Ballantyne home sale prices increased 5.7% to $522,067 in December 2022 compared with the same month one year ago. Median home sale prices increased 15.8% to $497,750 year-over-year in December 2022. Month-over-month, Ballantyne’s average and median home sale prices decreased. It should be pointed out that not all of the decrease is a result of a market downturn. The price mix of homes sold in a given month in an area like Ballantyne plays a big role as well.
Average Price Per Square Foot increased to $220/square foot in December 2022, up 2.3% over one year ago.
BALLANTYNE HOMES LIST TO SALE PRICE RATIO DECREASED IN DECEMBER 2022
Home sellers received a median 96.4% of list price in final sale price in December, down 4.4% year-over-year, but up 0.2% month-over-month. This is a clear indication that last year’s feeding frenzy is over, with Ballantyne home buyers having a window of opportunity to negotiate on price.
BALLANTYNE HOMES CONTINUED TO SELL RELATIVELY QUICKLY DESPITE AN INCREASE IN DAYS ON MARKET
Ballantyne homes continued to sell in good time, generally in about five weeks. Median Days on Market were 22 days, 18 days higher year-over-year, but three days lower month-over-month. Average Days on Market were 39 days year-over-year, up 19 days compared with December 2021. Average days on market were 8 days higher than in November 2022. The increase in days on market is another indication that the market has slowed to pre-pandemic levels.
BALLANTYNE SALES WERE DOWN IN DECEMBER 2022
Closed sales decreased 55.6%, while pending sales decreased 39.2% in December 2022 compared with one year ago. Much higher mortgage payments have prospective buyers pulling back from the market.
BALLANTYNE MONTHS SUPPLY OF HOMES STILL LOW & NEW LISTINGS DOWN IN DECEMBER 2022
Ballantyne’s months supply of homes at 0.8 months keeps it a seller’s market and we would need several more months of inventory to consider Ballantyne a balanced market, much less a buyer’s market. The months supply of homes increased from 0.5 months in December 2021 and was down by 0.2 months compared with November 2022. New listings, meantime, were down 58.4% compared with the same month one year ago.
Want to know what this would mean for your family if you decide to buy or sell a Ballantyne home?

I can help.
Call me today at 704-779-0813 or contact me here.
There’s absolutely NO OBLIGATION. A consultation with Nina Hollander is FREE.
BALLANTYNE REAL ESTATE MEDIAN PRICE TRENDS
10 HOTTEST SELLING BALLANTYNE AREA NEIGHBORHOODS

SEARCH BALLANYNE AREA HOMES

FREE Home Buyer Guide: “Things To Consider When Buying A Home”
WONDERING WHAT YOUR BALLANTYNE AREA HOME IS WORTH?

FREE Home Seller Guide: “Things To Consider When Selling Your House,”
THINKING OF SELLING YOUR HOME? CHECK OUT THE COLDWELL BANKER MARKETING ADVANTAGE
This Charlotte, North Carolina Ballantyne real estate December 2022 report is provided by Nina Hollander with Coldwell Banker Realty, Ballantyne area specialist, neighbor, and Greater Charlotte residential real estate expert. I’ve been opening doors for Ballantyne home buyers and sellers for since 1999.
If you’re considering selling or purchasing a home in the Charlotte metro area, I’d love an opportunity to earn your business, to exceed your expectations, and to show you why experience matters and how:
“The Right Broker Makes All The Difference.”